")
")

Part 1. Key Trends in Structural Economic Changes in the World and Ukraine[1]
The article, which consists of two parts, discusses the issues of long-term structural shifts in the Ukrainian economy against the background of structural transformations in the world economy during the last quarter-century. The author reveals main structural disproportions, deformations and their causes, associated not only with institutional imperfections, but also with the lack of strategic approaches to economic development and innovative passivity. In a generalized form, the article describes the main challenges that arise for a national economy in the context of the Fourth Industrial Revolution unfolding in the world. In this context, the paper exposes the serious imbalances in the development policy of Ukraine regarding science, education and innovation. It formulates the main principles on which the strategically oriented development policy of the country should be built under the conditions of cardinal global economic and technological transformations.
Keywords: structure of the economy, structural changes, structural transformations, world economy, development strategy, technological development, innovations, the Fourth Inustrial Revolution
In the course of transition to a market economy, the importance of its institutional aspect, which dominated in the entire mix of the economic reform agenda, has given birth to the principle mistake of treating the terms "structural reforms" and "institutional transformations" as actually identical.
However, the contemporary technological changes produce so profound structural shifts in all aspects of socio-economic activities that a mere introduction of market institutions is not sufficient to support them. Market self-regulation fails here, affected by a lack of certainty in the operation of market parameters during the periods of cardinal structural breakdown.
There is something naïve in the persisting perceptions that mass free market agents are able to identify and interpret correctly the innovative processes emerging due to dissemination of basically new technologies while even experts cannot give unambiguous replies to the questions concerning possible outcomes of the spread of certain technological innovations. That is why we should abandon the postulated linkage of the notions "structural change" and "structural reforms" exclusively to institutional environment parameters or classical macroeconomic policies. The state must influence actively the course of innovations and accelerate the adaptation of advanced technologies to safeguard its global and regional competitive advantage in the high-tech domain. It is these properties that are lacking in the economic policies of Ukrainian governments over the entire period since 1990.
The deployment of the global processes of technological change, which move ever more to the forefront of the worldwide economic discussions, including those held at leading global economic forums like the World Economic Forum (WEF), various discussion platforms within G20, and OECD[2], has not merely exacerbated extremely the issue of the structural inadequacy of Ukraine's economy. Essentially, it makes this question existential: to be or not to be.
The factor of time begins to play a crucial role in the conditions where basically new technologies of production and business are likely to change cardinally the global economic landscape within the next two or three decades. Passive behavior of the state and national business elite in such circumstances may cause fatal outcomes, while the leading world market actors might lose their interest in Ukraine and the country's products progressively fall out the newly emerging global markets.
Ukrainian businessmen encounter (even if they fail to see this) a real threat of depreciation of their capital resulting from the archaic technologies and organizational modes, and structural backwardness, which appear as direct outcomes of the prolonged periods of inhibited and even degraded culture of innovations.
Therefore, Ukraine urgently requires a real revolution in its attitudes to the issues of economic development, and an overturn in the mentality of public servants engaged in economic regulation, whose main criterion in decisionmaking must be real structural shifts aimed at the priority development of modern technologies and respective economic activities implying them.
During the last quarter of a century, Ukraine has been able to fully adhere to the global trend of post-industrialization that is associated with the advance development of the tertiary (services) sector. In 1990–2016, the share of services in the country's GDP doubled — from 30 to 59.2 percent. At the current level of this indicator, Ukraine can be unequivocally associated with a group of developing countries, though not the most dynamic of them (the rapidly growing East Asian countries have already approached the level of 70 percent, while the world's average makes 69 percent)[3]. At the same time, Ukraine has demonstrated an impressive scale of the relative compression of industrial sector. Having entered into the period of state independence and market transition with a hypertrophied industrial sector amounting to almost 45 percent of the country's GDP (in 1992 it reached almost 50 percent contrasting with 30–31 percent in the European Communities), the country suffered an abrupt fall of the industrial share in the economy. In 2015, it landed at the 25.6 percent point (actually world's average), while the share of manufacturing declined to 14 percent (below world's average). To a large extent, the post-industrialization in Ukraine has been attributable not so to a faster growth of the services sector (though Ukraine attained undisputable positive results in the development of the networks of retail trade, mobile communications, computer services and Internet) but to the accelerated deindustrialization caused by the lost competitiveness of the economy open to foreign competition.
At the start of market transformations, Ukraine's GDP had an excessively high share of agriculture (25.6% in 1990 and 20.4% in 1992)[4]. Initially, this indicator followed an explicitly downward trend and decreased by 2007 to 7.5 percent; however later on, followed a paradoxal rapid agrarianization: already in 2015, the agrosector's share in GDP jumped to 14.2%, though slightly moderated to 13.7% in 2016. This phenomenon indicates Ukraine's evolution towards less developed nations (on average, with a 26-percent share of the agricultural sector in their GDP) and heavily indebted poor countries (respectively, 27.8% of GDP in 2016). Meanwhile, the economically developed world has a miserably low share of agriculture: the EU — 1.5 percent (2016), OECD — 1.5% (2015) and even East Asia — 5.2% (2015), Latin America and the Caribbean — 5.6% (2016). This sort of structural evolution in Ukraine can hardly be explained in terms of comparative advantages of the country's economy, as even now Ukraine, according to the WTO (2017, p. 31, 112–113), does not belong to the group of leading ten exporters to global agricultural and food markets (where the EU holds up a strong leadership with its 1.5% of agrarian share in the GDP). We can rather attribute this phenomenon, first, to a relatively low (as compared to the world level) productivity, and second, to the stagnation of other economic sectors, while agriculture and food production become economic stabilizers due to their reliance on basic needs of impoverished population.
In the structure of Ukraine's manufacturing sector, attention should be focused on the distorted correlation of the shares of two key industries, which are classified by international statistics as "food, beverages and tobacco" and "machinery and transport equipment" (Figure 1).
Among the selected countries, only Ukraine accompanied with South Africa and Russia have the share of food sector in manufacturing higher than that of machinery and transport equipment. And while for South Africa this situation is quite understandable, as it reflects the posteffects of the country's colonial history that cannot be overcome within a short period of time, the Ukrainian and Russian cases, probably, might be incorporated into students' textbooks and become a subject of indepth research of distortions in economic development. The rationale for this arises from their demonstration of a specific "structural reverse" — from the production of machines to the production of food. Such sort of evolution, even accounting for its certain positive social and economic outcomes (better satisfaction of demand at food markets, better conditions and more stable prices of food provision for population at large, positive impact on trade balance, etc.), testifies on the whole about the process of structural simplification, and about decrease in the potential of economic growth and development. The latter cannot be augmented without adequate investments, and these such investments are unthinkable without machinery and equipment.

Note. Presented here are the latest available data of international statistics: 2014 — Canada, Finland, France, Germany, India, Korea, Rep., Spain, Italy, Russia, Singapore, Sweden, and Ukraine;
2013. — Brazil, Poland, Switzerland, and United Kingdom; 2012 — Japan and Malaysia; 2011 — USA; 2010 — South Africa; 2007 — China.
Figure 1. The structure of output by selected manufacturing sectors (sector's value added as percent of value added in manufacturing)
Source: World Bank. World Development Indicators Databank.
The abovesaid provides grounds for a summarizing conclusion: we are witnessing a process of structural simplification of the economy and its approaching to the structural characteristics of the world's less developed countries.
It is well known that the absolute majority of national economies under globalization become extremely dependent on changes in the structure of world trade. For Ukraine, with its enhanced openness to external environment (the value of exports to GDP has been invariably over the 50 percent mark), the structural parameters of international exchange are of exclusively high significance.
The longterm evolution of the structure of Ukrainian exports has been parallel to the overall structural shifts in the economy, each of these trends mutually amplifying the other in this "tandem". At that, under the conditions of the lack of efficient national policy aimed at implementation of structural priorities in economic development, changes in Ukraine's export structure have served as a potent catalyst of the process of structural simplification of the Ukrainian economy.
First of all, one can distinguish in the Ukrainian exports an amazing expansion of the share of food products — from 9.2% in 2000 to 38.0% in 2015, that is, more than fourfold within 15 years (Figure 2). This indicator is well above average indicators of all country groups. And despite the fact that it is lower than respective 1995-2000 indicators of heavily indebted poor countries, in the latter case this indicator is showing a downward trend while in Ukraine it is on the rise.
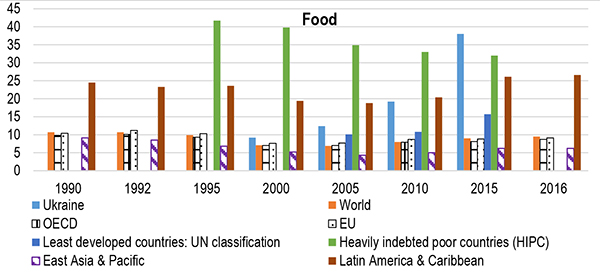
* Food comprises the commodities in SITC sections 0 (food and live animals), 1 (beverages and tobacco), and 4 (animal and vegetable oils and fats) and SITC division 22 (oil seeds, oil nuts, and oil kernels). Data for HIPC — 2014, not 2015.
Figure 2. Changes in the share of food in total merchandise exports (1990–2016)
Source: World Bank staff estimates through the WITS platform from the Comtrade database maintained by the United Nations Statistics Division.
The share of ores and metals in Ukraine's export (Figure 3) was in 2015 approximately twice as high as on average in the world and OECD countries, and was three times higher than the EU indicator. Moreover, it is to be noted that the mentioned indicators do not include ferrous metals and products thereof, which are in Ukraine mostly very similar (as regards the rate of processing of raw material) to the production of non-ferrous metals included here; therefore, the bias towards metal exporting in Ukraine appears significantly higher than the above figure shows.
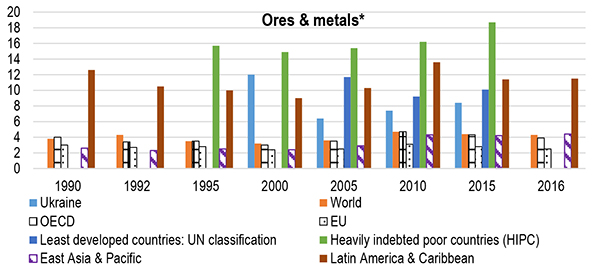
* Ores and metals comprise the commodities in SITC sections 27 (crude fertilizer, mineralises); 28 (metalliferous ores, scrap); and 68 (non-ferrous metals). Data for HIPC — 2014, not 2015.
Figure 3. Changes in the share of ores and metals in total merchandise exports (1990–2016)
Source: World Bank staff estimates through the WITS platform from the Comtrade database maintained by the United Nations Statistics Division.
On the other side, the share of manufactures (Figure 4) has shown a durable downward trend in Ukrainian export. In 2000–2005, it had been approaching closely to the 70 percent mark (69.4%), but in the last decade declined to 50.1%. According to this structural indicator, Ukraine now appears considerably inferior not only to those of EU (80.3%), OECD (75.0%) and East Asia (80.7%) but also to the world average (72.3%). Overall, this decline combined with the rise of ores and metals supplies testifies about a shift of Ukraine's comparative and competitive advantages at global markets towards less sophisticated goods, with lower value added.

* Manufactures comprise commodities in SITC sections 5 (chemicals), 6 (basic manufactures), 7 (machinery and transport equipment), and 8 (miscellaneous manufactured goods), excluding division 68 (non-ferrous metals).Data for HIPC — 2014, not 2015.
Figure 4. Changes in the share of manufactures in total merchandise exports (1990–2016)
Source: World Bank staff estimates through the WITS platform from the Comtrade database maintained by the United Nations Statistics Division.
In this context, it is important to note indistinct dynamics in Ukraine's supplies of high-tech commodity[5] groups (Figure 5 and Table 1). Their share in 2015 made only 7.3 percent while in EU countries — 16.9%, OECD member-states — 17.7%, in the world on average — 18.5%, and in East Asia — 24.6% (i.e. in China — 25.8%, Rep. of Korea — 26.8%, Malaysia — 42.8%, and Singapore — 49.3%). However, one could refer to a recent positive development in this respect: the share of high-tech products in Ukraine's exports was lower than their share in exports of East Asian countries by 6.4 times in 2000 and by 8.3 times in 2005, but in 2015 this gap shrank to 3.4 times.

* 1991 instead of 1990. [6] 2014 instead of 2015.
Figure 5. High-tech exports as a share of manufactured exports: Ukraine vs. selected country groups (%)
Source: UN Comtrade database through WITS platform.
Table 1. High-tech exports as a share of manufactured exports: Ukraine vs. selected countries (%)
|
Countries |
1990 |
1992 |
1995 |
2000 |
2005 |
2010 |
2015 |
2016 |
|
Ukraine |
3 9** |
5.2 |
3.7 |
4.3 |
7.3 |
|||
|
Brazil |
6.5 |
4.9 |
4.9 |
18.7 |
12.8 |
11.2 |
12.3 |
13.4 |
|
China |
6.4 |
10.4 |
19.0 |
30.8 |
27.5 |
25.5 |
25.0 |
|
|
India |
3.9 |
4.0 |
5.8 |
6.3 |
5.8 |
7.2 |
7.5 |
7.1 |
|
South Africa |
7.0 |
5.7 |
7.0 |
6.7 |
4.6 |
5.9 |
5.3 |
|
|
Russia |
9 7** |
16.1 |
8.4 |
9.1 |
13.8 |
10.7 |
||
|
Japan |
24.2 |
24.1 |
26.5 |
28.7 |
23.0 |
18.0 |
16.8 |
16.2 |
|
Canada |
13.8 |
14.9 |
15.0 |
17.7 |
13.1 |
14.0 |
13.8 |
12.9 |
|
USA |
32.5 |
32.6 |
30.3 |
33.8 |
29.9 |
20.0 |
19.0 |
20.0 |
|
Switzerland |
15.6 |
15.9 |
17.1 |
22.2 |
24.2 |
25.3 |
26.8 |
27.1 |
|
United Kingdom |
23.6 |
23.6 |
27.0 |
32.4 |
28.0 |
21.0 |
20.8 |
21.6 |
|
Finland |
7.5 |
9.1 |
14.7 |
27.4 |
25.1 |
10.9 |
8.7 |
|
|
France |
16.7 |
18.4 |
19.2 |
24.6 |
20.3 |
24.9 |
26.8 |
26.7 |
|
Germany |
12.0 |
12.7 |
13.7 |
18.6 |
17.4 |
15.3 |
16.7 |
16.9 |
|
Italy |
7.8 |
8.6 |
8.1 |
9.5 |
8.0 |
7.2 |
7.2[7] |
7.5 |
|
Spain |
6.7 |
7.4 |
7.3 |
8.0 |
7.3 |
6.4 |
7.1 |
7.0 |
|
Poland |
3.5 |
2.6 |
3.4 |
3.8 |
6.7 |
8.8 |
8.5 |
|
|
Sweden |
12.9 |
13.3 |
16.4 |
22.8 |
16.9 |
13.7 |
14.3 |
14.3 |
|
Korea, Rep. |
18.0 |
19.8 |
26.0 |
35.1 |
32.5 |
29.5 |
26.8 |
26.6 |
|
Malaysia |
38.2 |
38.9 |
46.1 |
59.6 |
54.6 |
44.5 |
42.8 |
43.0 |
|
Singapore |
39.9 |
44.8 |
54.1 |
62.8 |
56.9 |
49.9 |
49.3 |
67.4 |
Noteworthy, the period since 2000 (which was the peak in the development of high-tech markets within the framework of the previous Kondratiev technological wave) has demonstrated a decline of the mentioned share in many countries that are major producers and suppliers of high-tech manufactures. It can be explained by the oncoming of a downward phase of the technological cycle (K-wave) when standardized technological products begin to prevail in the market; economically (due to reduction of costs) it is much more profitable to produce such products in countries with lower production costs, especially regarding labor costs. This situation has predetermined the logic of offshoring in business behavior, that is moving of respective high-tech production facilities (which have already exhausted their development potential) over to less developed countries. This process has had two important outcomes: first, an overall reduction of costs in the production of hightech manufactures accompanied by a respective fall in the value of their exports; second, alongside with the shrinkage of the shares of high-tech exports in technologically advanced nations we can register their expansion among newly emerging national producers with a comparative advantage in regard to wage levels. It is just within this trend that we could find a certain increase in the shares of high-tech exports in Ukraine, Poland, Russia, India, and especially in Vietnam, which succeeded in expanding this sort of export supplies in 2000-15 almost 57-fold (from $684 million to $38736 million).
However, an inevitable oncoming of a new K-wave of technological development, which is already on the threshold, is certain to bring about essential structural changes in high-tech products commerce. Those countries that are holding the lead in generating new technologies, even when placing production facilities offshore, retain in their base countries R&D centers and those production lines, which embody the most advanced technological decisions and require permanent scientific and qualified engineering support. At a specific development stage, ushering in a massive transition from the fifth to the sixth technology generation, it is these countries generating technological innovations who are to become chief exporters of innovative products, while many of the existing offshore production facilities of the previous generation are doomed to contraction or even closure. And those countries, which passively rest on the mentioned schemes of economic development without own efforts directed at technological advance, may well get into a trap.
The issue of the evolution of international trade in modern ICT-intensive goods deserves here special attention. Figure 6 and Table 2 convincingly prove that this group of manufactures represents the core of the entire category of high-tech products, which is a direct consequence of the role of ICT in the advance of the fifth technological generation.
The area of East Asia & Caribbean has achieved most in developing the potential of ICT production accounting for up to % of total merchandise exports or even more in some years[8]. The world's average, which reached 15% in 2000 (the year when ICT spread culminated), moderated to 11.1% by 2015, though even this level looks very high. Against this background, Ukraine appears as utterly indistinct: its ICT goods accounted for 1.5% of exports in 2000 and merely 0.8% in 2015.
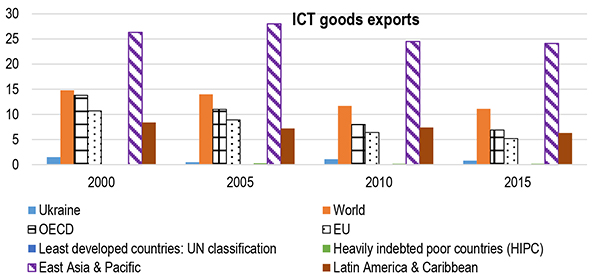
* 2015 column contains data for 2012.
Figure 6. ICT goods as a share of total goods exports: Ukraine vs. selected country groups (%)
Source: United Nations Conference on Trade and Development's UNCTAD stat database.
Table 2. ICT goods as a share of total goods exports: Ukraine vs. Selected countries (%)
|
Countries |
2000 |
2005 |
2010 |
2015 |
|
Ukraine |
1.5/2.5 |
0.5/4.0 |
1.1/3.2 |
0.8/4.0 |
|
Brazil |
4.0/13.6 |
3.1/12.1 |
1.0/9.5 |
0.4/8.4 |
|
China |
17.7/20.2 |
30.7/20.3 |
29.1/20.4 |
26.6/23.5 |
|
India |
1.7/5.5 |
1.1/7.6 |
2.0/6.3 |
0.9/8.6 |
|
South Africa |
1.6/12.3 |
1.2/11.1 |
1.2/9.2 |
1.4/8.8 |
|
Russia |
0.4/3.7 |
0.2/7.8 |
0.2/8.5 |
0.8/9.1 |
|
Japan |
22.7/16.2 |
16.9/13.5 |
10.7/12.0 |
8.5/12.8 |
|
Canada |
7.6/13.1 |
3.9/9.1 |
2.8/8.4 |
2.1/7.1 |
|
USA |
20.1/17.4 |
14.3/13.7 |
10.6/14.2 |
9.4/13.8 |
|
Switzerland |
3.8/9.8 |
2.6/7.4 |
1.6/5.9 |
1.1/4.1 |
|
United Kingdom |
17.5/18.7 |
13.5/12.9 |
5.8/9.5 |
4.1/8.3 |
|
Finland |
23.6/16.6 |
20.3/14.3 |
6.4/8.2 |
2.5/6.9 |
|
France |
10.8/11.8 |
6.3/8.5 |
4.3/7.3 |
4.0/6.7 |
|
Germany |
8.4/11.6 |
7.9/11.5 |
5.1/9.2 |
4.7/8.4 |
|
Italy |
4.4/8.8 |
3.1/7.1 |
2.2/7.7 |
1.9/5.2 |
|
Spain |
4.7/8.5 |
3.7/7.2 |
2.2/6.7 |
1.3/5.0 |
|
Poland |
4.1/9.3 |
4.0/7.9 |
9.6/9.8 |
8.1/9.8 |
|
Sweden |
17.7/14.4 |
11.2/11.1 |
9.7/11.3 |
6.9/10.2 |
|
Korea, Rep. |
34.5/21.6 |
30.0/15.2 |
21.4/11.9 |
21.7/14.7 |
|
Malaysia |
52.7/40.9 |
43.4/38.0 |
34.0/29.8 |
30.0/24.0 |
|
Singapore |
55.0/40.8 |
45.5/37.9 |
34.3/27.9 |
33.5/28.0 |
Source: United Nations Conference on Trade and Development's UNCTAD stat data base.
Contemporary ICT production develops within transnationalized production networks based on production co-operation and the formation of long chains of value added. That is why East Asian & Pacific countries have the highest ICT shares not only in export but also in import of goods.
Ukraine demonstrates here a low (as compared to the world's average) indicator: only 4% of Ukrainian imports in 2015 was associated with ICT goods (no change from the 2005 level). The reason of the chronically understated share of ICT products in Ukraine's imports is the country's separation from transnationalized production networks existing in this field. This makes the national ICT product uncompetitive and predetermines its low level of export, which inevitably restricts the overall development of ICT goods.
Modern global trends in structural evolution of international trade in services are associated with a considerable decrease in the relative significance of transport
services. Within the period of 1990–2016, their share in total world's exports of services decreased from 31.3% to 19.5%, and in the group of economically advanced OECD countries — from 29.0% to 17.7%. This process is caused both by changes in the structure of world trade (the growth of high-value goods with a decreasing share of transportation costs in their aggregate cost) and by the rationalization of production placement within global networks, as well as by enhancement in the efficiency of transportation due to the spread of modern instruments of logistics. Ukraine also succeeded in considerable reduction of the share of transport services — from 73.2% in 1995 to 44.1% in 2016[9]; nevertheless, even the reduced Ukraine's indicator is still more than twice the average of actually all country groups.
On the other side, the registered substantial growth of the share of insurance & finance services appears as a direct reflection of progressing financialization of the entire economy under globalization. In terms of the world's average, this share doubled in 1990–2016 — from 4.3% to 8.5%, and in OECD member states — from 5.2% to 10.1%. Noteworthy, the appearance, in the countries of Latin America and especially in the Caribbean, of a number of financial centers also caused a substantial increase in the share of these services in total services exports — from 3.9% to 7.7% in 2015 (in 2016 this indicator decreased to 6.8%). Ukraine, with its unstable and institutionally weak financial sector, falls out of this trend: this share fluctuates in the 1–3 percent range, with a downward trend since 2010; in 2016 the indicator made only 0.9%.
But the most important trend is associated with the transformation of the group of computer, information and other services into the leading sector in the development of services exports (Figure 7). In 1990, it accounted for 32.1% of the world's aggregate commercial service exports and 33.1% in that of OECD; in 2016, these indicators reached, respectively, 45.3% and 48.1%. In the EU, the average indicator increased from 34.7% to 52.3%. But even more pronounced expansion was registered in such countries as Brazil (from 23.2% to 61.3%), China (from 18.7% to 58.7%), India (from 42.7% to 72.2%), Germany (from 37.1% to 54.6%), and
France (from 37.4% to 56.1%). It should be noted that, contrary to the above mentioned groups of services where Ukraine has deviated far from typical aggregate group indicators, in this area it is entirely "in trend": the share of computer, information and other services in Ukraine's commercial service exports grew in 1995–2016 from 17.7% to 46.2%.

* They include such activities as international telecommunications, and postal and courier services; computer data; news-related service transactions between residents and nonresidents; construction services; royalties and license fees; miscellaneous business, professional, and technical services; and personal, cultural, and recreational services.
Figure 7. Computer, communications and other services as a share of commercial service exports (%)
Source: International Monetary Fund, Balance of Payments Statistics Yearbook and data files.
The share of ICT services, which are the core of the above mentioned service group, expanded worldwide in 1990-2016 from 20.7% to 31.4%, in OECD member states — from 21.2% to 30.9%, EU countries — from 22.6% to 34.8%, and in East Asian states — from 20.5% (2000) to 28.4%. In a number of countries (Table 3) it is currently close or even above one half of total commercial service exports. It is just this sector of ICT services where Ukraine has managed to fit in the global development trends: their share increased from 13.5% to 31.8% and reached the world's average.
The current spread of global value chains (GVC) represents a leading and increasing trend of contemporary developments in the world economy's structure[10].It is essentially a manifestation of the global spread of cooperative relations, and we may treat it, in this sense, as a positive phenomenon. However, it is not infrequent when it conceals certain unfavorable trends towards shaping technological dependence, with turning of a national economy into an appendage of more developed economies — technology leaders.
Table 3. ICT service exports in Ukraine and selected countries as percent of service exports (according to balance-of-payments statistics)* 2012.
|
Countries |
1990 |
1992 |
1995 |
2000 |
2005 |
2010 |
2015 |
2016 |
|
Ukraine |
13.5 |
8.9 |
7.6 |
17.3 |
31.4 |
31.8 |
||
|
Brazil |
21.6 |
47.6 |
43.0 |
46.7 |
56.4 |
54.7 |
||
|
China |
18.4 |
32.6 |
23.5 |
11.9 |
20.9 |
-6.1 |
38.2 |
40.4 |
|
India |
55.0 |
67.2 |
64.1 |
67.3 |
67.0 |
|||
|
South Africa |
9.5 |
7.5 |
15.4 |
10.3 |
9.8 |
13.2 |
16.9 |
17.5 |
|
Russia |
21.8 |
19.3 |
23.7 |
30.4 |
32.1 |
30.8 |
||
|
Japan |
29.0 |
19.8 |
24.9 |
23.0 |
24.4 |
|||
|
Canada |
44.9 |
47.2 |
50.2 |
33.8 |
39.3 |
42.7 |
40.8 |
38.9 |
|
USA |
14.4 |
15.3 |
15.8 |
18.2 |
19.8 |
22.4 |
22.9 |
23.7 |
|
Switzerland |
15.7 |
15.5 |
15.9 |
18.4 |
19.8 |
21.5 |
29.5 |
28.8 |
|
United Kingdom |
26.3 |
25.1 |
30.1 |
30.4 |
34.5 |
35.9 |
34.0 |
|
|
Finland |
32.8 |
36.0 |
42.2 |
42.1 |
32.3 |
39.6* |
50.6 |
48.9 |
|
France |
29.8 |
22.1 |
24.8 |
33.2 |
36.3 |
34.4 |
41.7 |
40.8 |
|
Germany |
18.7 |
23.0 |
26.8 |
30.0 |
32.9 |
36.6 |
39.7 |
40.7 |
|
Italy |
28.0 |
21.9 |
15.5 |
24.8 |
30.1 |
30.8 |
30.8 |
31.6 |
|
Spain |
9.5 |
8.6 |
13.8 |
27.0 |
27.8 |
|||
|
Poland |
14.8 |
15.0 |
17.4 |
33.0 |
31.7 |
32.4 |
||
|
Sweden |
14.2 |
14.8 |
18.3 |
38.9 |
38.5 |
46.4 |
45.7 |
46.6 |
|
Korea, Rep. |
24.2 |
26.2 |
29.0 |
23.0 |
19.1 |
15.2 |
23.1 |
26.1 |
|
Malaysia |
38.5 |
19.4 |
20.2 |
23.6 |
23.1 |
|||
|
Singapore |
16.9 |
20.4 |
22.2 |
22.9 |
29.4 |
29.1 |
Source: International Monetary Fund, Balance of Payments Statistics Yearbook and data files.
In order to evaluate the development of these processes, OECD and WTO currently make use of the data of their common TiVA (Trade in Value Added) database, in particular regarding changes in the shares of intermediate products in exports and imports (Table 4).
Table 4. Inclusion in international (global) value chains: shares of intermediate products in exports and imports of selected countries (%)
|
Countries |
2005 |
2010 |
2015 |
|||
|
exports |
imports |
exports |
imports |
exports |
imports |
|
|
North America |
||||||
|
Canada |
43.8 |
45.5 |
45.6 |
42.3 |
44.6 |
41.9 |
|
Mexico |
38.8 |
60.0 |
35.6 |
59.0 |
39.4 |
57.2 |
|
USA |
56.9 |
34.4 |
52.0 |
33.3 |
48.1 |
36.4 |
|
South America, Central America and Caribbean |
||||||
|
Argentina |
56.7 |
53.3 |
60.8 |
51.4 |
64.8 |
51.5 |
|
Brazil |
58.2 |
55.0 |
63.3 |
49.4 |
66.6 |
52.5 |
|
Venezuela |
10.7 |
39.9 |
5.8 |
41.2 |
10.0 |
37.4 |
|
Columbia |
32.7 |
53.3 |
26.1 |
48.1 |
26.9 |
44.1 |
|
Nicaragua |
28.1 |
29.8 |
30.1 |
28.3 |
30.4 |
38.7 |
|
Peru |
73.8 |
46.4 |
78.4 |
46.2 |
71.9 |
46.3 |
|
Uruguay |
45.6 |
42.0 |
56.7 |
37.6 |
48.6 |
38.5 |
|
Chile |
77.2 |
35.9 |
80.4 |
33.3 |
73.9 |
36.0 |
|
Countries |
2005 |
2010 |
2015 |
|||
|
exports |
imports |
exports |
imports |
exports |
imports |
|
|
Europe |
||||||
|
Austria |
46.6 |
43.4 |
51.3 |
46.2 |
50.7 |
47.0 |
|
Belgium |
49.4 |
47.5 |
44.0 |
48.3 |
49.5 |
48.1 |
|
Bulgaria |
50.5 |
42.1 |
52.0 |
43.5 |
55.2 |
45.7 |
|
United Kingdom |
41.0 |
38.2 |
39.9 |
37.9 |
47.9 |
39.1 |
|
Greece |
41.7 |
33.0 |
34.6 |
28.9 |
32.3 |
30.4 |
|
Denmark |
33.6 |
40.6 |
35.7 |
40.4 |
37.4 |
39.9 |
|
Estonia |
56.0 |
49.6 |
50.5 |
48.0 |
49.1 |
45.0 |
|
Ireland |
52.5 |
43.5 |
52.6 |
35.7 |
53.0 |
34.7 |
|
Spain |
43.3 |
41.5 |
43.0 |
40.9 |
41.2 |
43.4 |
|
Italy |
45.7 |
42.7 |
46.3 |
43.9 |
44.5 |
46.4 |
|
Latvia |
57.0 |
37.7 |
50.3 |
34.9 |
45.9 |
33.6 |
|
Lithuania |
35.3 |
36.4 |
35.5 |
32.1 |
39.1 |
35.6 |
|
Netherlands |
35.1 |
33.5 |
33.1 |
31.6 |
35.2 |
33.9 |
|
Germany |
47.2 |
46.0 |
46.9 |
47.0 |
44.8 |
47.3 |
|
Poland |
49.3 |
51.6 |
46.9 |
49.7 |
45.8 |
49.1 |
|
Portugal |
50.6 |
43.1 |
51.5 |
42.4 |
48.5 |
44.7 |
|
Romania |
48.2 |
49.0 |
52.3 |
53.8 |
56.9 |
55.3 |
|
Slovak Republic |
51.6 |
52.0 |
45.8 |
54.9 |
44.3 |
51.8 |
|
Slovenia |
48.7 |
52.5 |
43.0 |
45.6 |
42.5 |
43.7 |
|
Czech Republic |
56.5 |
55.6 |
51.1 |
54.5 |
51.3 |
54.2 |
|
Finland |
55.1 |
44.3 |
60.8 |
43.3 |
55.7 |
39.5 |
|
France |
42.0 |
41.4 |
44.6 |
41.8 |
42.4 |
42.7 |
|
Hungary |
50.4 |
51.4 |
44.0 |
53.0 |
52.6 |
55.5 |
|
Croatia |
39.8 |
38.1 |
42.8 |
39.7 |
46.6 |
40.3 |
|
Sweden |
49.8 |
44.4 |
51.1 |
42.9 |
49.3 |
38.9 |
|
Switzerland |
45.5 |
41.9 |
45.5 |
41.8 |
57.2 |
57.9 |
|
Turkey |
38.2 |
52.3 |
45.9 |
50.7 |
45.2 |
50.9 |
|
CIS, including associated and former member states |
||||||
|
Azerbaijan |
6.0 |
53.3 |
1.8 |
54.0 |
3.4 |
51.0 |
|
Belarus |
35.5 |
37.9 |
39.2 |
36.7 |
39.6 |
33.3 |
|
Armenia |
73.4 |
48.2 |
74.1 |
39.6 |
58.4 |
40.4 |
|
Georgia |
45.8 |
33.7 |
54.1 |
29.4 |
44.6 |
35.7 |
|
Kazakhstan |
28.4 |
42.3 |
26.2 |
32.0 |
29.8 |
43.7 |
|
Kyrgyz Republic |
66.2 |
37.3 |
48.1 |
28.5 |
61.0 |
37.2 |
|
Moldova |
31.7 |
39.1 |
36.1 |
36.4 |
46.8 |
40.3 |
|
Russian Federation |
25.3 |
27.7 |
20.0 |
32.5 |
27.0 |
40.2 |
|
Ukraine |
72.5 |
37.4 |
71.8 |
34.8 |
83.9 |
39.9 |
|
Africa |
||||||
|
Algeria |
1.8 |
50.9 |
2.1 |
58.5 |
5.0 |
54.3 |
|
Ghana |
95.7 |
39.5 |
63.1 |
33.8 |
84.0 |
50.6 |
|
Ethiopia |
56.1 |
44.9 |
68.5 |
44.4 |
47.6 |
76.5 |
|
Egypt |
41.7 |
70.4 |
43.7 |
58.3 |
44.1 |
60.3 |
|
Zambia |
90.5 |
59.1 |
97.1 |
59.1 |
94.2 |
50.0 |
|
Zimbabwe |
63.9 |
59.1 |
92.8 |
57.9 |
92.0 |
55.8 |
|
Kenia |
27.7 |
41.3 |
33.9 |
41.3 |
25.0 |
48.7 |
|
Cote-d'Ivoire |
43.7 |
26.7 |
52.6 |
30.0 |
66.2 |
39.0 |
|
Mauritius |
29.8 |
38.0 |
25.0 |
37.4 |
21.9 |
32.6 |
|
Morocco |
46.8 |
50.1 |
57.1 |
48.2 |
50.4 |
54.1 |
|
Nigeria |
2.3 |
42.2 |
11.2 |
51.3 |
5.8 |
37.4 |
|
Countries |
2005 |
2010 |
2015 |
|||
|
exports |
imports |
exports |
imports |
exports |
imports |
|
|
South Africa |
59.1 |
31.5 |
56.1 |
31.0 |
48.2 |
26.8 |
|
Sudan |
13.5 |
58.0 |
15.2 |
66.0 |
79.8 |
40.1 |
|
Tanzania |
75.6 |
45.5 |
76.8 |
42.1 |
81.6 |
38.3 |
|
Tunisia |
33.7 |
58.0 |
39.9 |
57.6 |
43.8 |
57.6 |
|
Central African Republic |
92.2 |
30.3 |
62.1 |
33.0 |
61.2 |
39.3 |
|
Middle East |
||||||
|
Israel |
64.7 |
52.4 |
68.0 |
46.5 |
71.0 |
46.3 |
|
Iran |
8.8 |
48.6 |
13.9 |
49.6 |
17.7 |
68.8 |
|
Libya |
43.5 |
33.7 |
47.9 |
35.6 |
28.5 |
33.5 |
|
United Arab Emirates |
14.2 |
42.3 |
20.9 |
44.0 |
22.5 |
41.1 |
|
Qatar |
6.3 |
53.6 |
2.3 |
53.2 |
8.4 |
48.4 |
|
Kuwait |
4.6 |
32.0 |
5.0 |
41.2 |
6.9 |
37.1 |
|
Saudi Arabia |
8.3 |
47.9 |
11.2 |
46.9 |
19.3 |
42.0 |
|
Asia, Australia and Oceania |
||||||
|
Australia |
45.4 |
34.3 |
53.1 |
33.0 |
54.0 |
30.4 |
|
Bangladesh |
13.8 |
55.0 |
11.4 |
73.1 |
5.8 |
71.5 |
|
Vietnam |
19.8 |
60.9 |
28.8 |
65.4 |
30.9 |
69.2 |
|
Hong Kong, China |
2.8 |
6.0 |
2.4 |
6.7 |
1.0 |
2.1 |
|
India |
53.8 |
49.5 |
48.9 |
51.9 |
46.6 |
53.8 |
|
Indonesia |
47.1 |
37.8 |
51.0 |
53.6 |
49.5 |
58.5 |
|
China |
38.6 |
66.7 |
39.8 |
63.7 |
42.3 |
60.9 |
|
Chinese Taipei |
60.8 |
57.0 |
68.0 |
56.5 |
70.9 |
52.8 |
|
Korea, Republic |
52.1 |
51.2 |
53.1 |
49.5 |
57.1 |
49.5 |
|
Malaysia |
54.3 |
68.3 |
58.0 |
66.1 |
59.0 |
62.0 |
|
Singapore |
60.1 |
57.5 |
57.6 |
50.0 |
58.0 |
52.1 |
|
Thailand |
47.6 |
57.7 |
51.1 |
60.8 |
47.7 |
56.4 |
|
Philippines |
66.5 |
72.8 |
47.2 |
61.5 |
68.1 |
59.1 |
|
Japan |
52.3 |
38.3 |
54.6 |
38.6 |
53.0 |
38.3 |
Indicators below 35%. Indicators above 65%.
Source: Author's calculations and compilation on the basis of WTO (2017) and WTO (2016).
An analysis of the Table 4 data provides an opportunity to make the following summarizing conclusions:
- The absolute majority of countries, which have achieved success and stability in their development, are characterized by a rather stable share of intermediate products both in exports and imports — mainly within 40–60% of their gross value. On the whole, the range of 35–65% may be regarded as a norm, and deviations from this range may serve as an evidence of existing structural problems in the economy or economic policy.
- Some countries that have a rather high level of economic development and a stable economy sometimes deviate, and occasionally even significantly, from the mentioned range as a result of certain objective factors, such as:
- Specific geographical location: far off countries (i.e. Australia and New Zealand) may experience certain difficulties with inclusion into global or macroregional value chains for reasons of economic feasibility: for them, indicators of intermediate goods supplies (especially for imports) will tend to decrease. A large and diversified internal market that easily provides with partners to create efficient value chains (typical example — imports of the USA).
- A specific position in the world trading system associated with the functions of a reexport commerce center (Hong Kong, China, and United Arab Emirates) or a crude oil international trade center (Netherlands).
- Specialization in production of energy carriers, which are not included, unlike the majority of raw materials, into value chains (oil- and gas-producing Middle East countries, and Russian Federation).
- The majority of less developed countries are characterized by instability of indicators characterizing intermediate products supplies. It testifies about the lack of stable niches in the system of international division of labor and their excessive dependence on spontaneous fluctuations in international market conditions. Production value chains of less developed nations are subject to increased vulnerability.
- The frequency of deviations from the norm is much higher in the area of less developed economies than in advanced economies. Here we can distinguish three different variants, in which these deviations appear:
- A significant decrease in the intensity of inclusion into international (global) value chains caused by an inadequate level of development and/or economic policy targets hindering effective inclusion into international cooperation. These barriers tend to become lower for most countries over time (rather indicative here is the case of Vietnam).
- An overtly excessive intensity of inclusion into international (global) value chains caused by endeavors to accelerate economic modernization. In most cases, it is associated with an active attraction of foreign-based transnational (multinational) companies and shaping of favorable conditions for foreign direct investments that stimulate the growth of the share of intermediate goods in imports. Significantly, one can hardly find a case of this sort in the CIS region.
- A noticeable overstatement of the share of intermediate goods in a country's exports may serve not only as a case of successful inclusion into international production networks but also testify about growing technological dependence on more developed partners, with a less developed participant playing the part of a supplier of raw materials or semi-finished products used by a more developed partner (the "center-periphery" or "coreperiphery" model). That is why many countries with overstated shares of intermediate products in their exports (unlike countries with high shares of such products in imports) cannot serve as an example of effective economic development; on the contrary, it may be an alarm signaling about possible shaping of a distorted structure of inclusion into international division of labor.
Ukraine has practiced inclusion into international production patterns on the basis of a rather distorted and asymmetrical model (variant "c") where the excessive dependence on foreign markets for semi-finished goods is not backed by adequate inclusion into international production networks along the lines of importing. Within the decade of 2005–2015, the share of intermediate products (semi-finished goods) in Ukrainian exports rose up to critically high 83.9%, while the share of intermediate products in imports (that might have fostered economic modernization) increased only marginally — from 37.7 to 39.9%. Taking into account the international experience in economic development (first of all of many African countries), we may assert that such characteristics are disastrous in view of longterm development prospects.
Generally speaking, the performed analysis of the structural parameters inherent in the development of contemporary world system of external economic transactions exposes significant changes, on which different countries react also differently. The countries that go not merely "in trend" but even ahead of it may envisage strengthening of their future position within the world economy. Those lagging behind, not to mention those who ignore global megatrends, are destined to progressive weakening of their positions.
Ukraine is mostly present in the second of the mentioned groups — and this situation should be changed cardinally, if the country really hopes to implement the European perspective and hold a proper place in the world economy. However, this task requires shifts in another structural aspect of utmost importance, that is, in the structural characteristics of demand. The dynamics and structure of market demand constitutes a fundamental factor of overall economic evolution and those structural shifts that are taking place in the economy. No nationwide or international development plans or programs, no budget subsidies or direct financial infusions in the economy can achieve an effect on the evolution of an economic structure comparable with that of shifts in the structure of market demand. That is why we can affirm that preconditions for a qualitative rise of a national economy, likewise for a possible economic decline, are shaped primarily in the domain of public demand.
First of all, contrary to widespread views that modern world economy is orientated mainly at expanding consumption and increasing satisfaction of human needs in various kinds of goods, the share of household final consumption as percent of GDP in the world's total has demonstrated an amazing stability during 1990–2016, with fluctuations around 58% in a rather narrow corridor (Figure 8).
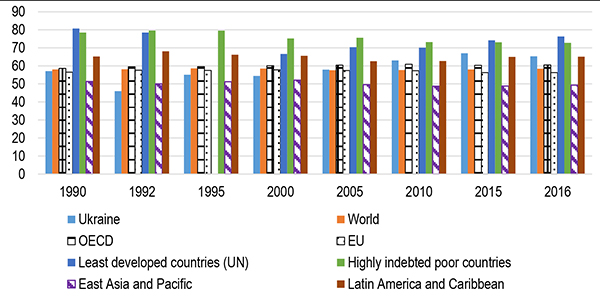
Figure 8. Household final consumption expenditure as percent of GDP (1990–2016)
Source: The World Bank databank.
In this relation, a slightly higher level of final consumption (59–61%) is characteristic to advanced economies (OECD) because they have higher productivity (of
labor and capital). Naturally, we can find many considerably larger deviations among a number of advanced countries with specific economic models.
Outside the domain of Western developed economies, there are two really significant cases of substantial deviation from the above mentioned worldwide parameters of household final consumption. One of them is represented by East Asia region where the shares of private consumption have been essentially lower — 49–52% of GDP, which is directly determined by extremely high levels of savings and investments. For instance, in the Republic of Korea this indicator fluctuated in 1990–2016 in the range of 49-54%, Malaysia — 44–55%, Singapore — 36–45%, while in China it even tended downward — from 48.3% in 1990 to 37.1% in 2015 (in 2016 it grew to 39.0%).
Another "anomaly" is represented by poor and least developed countries, which consume, seemingly in a paradoxal way, relatively much more than advanced economies or successful developing nations: the relevant indicator for the least developed countries fluctuated in the same period in the range of 67–81% and that of heavily indebted poor countries — 73–80%. However, there is actually no paradox here: these countries are locked in the process of meeting basic material needs of their poor and often rapidly growing population; they simply have no money left for savings, and this causes a formation of a vicious circle (poverty trap) which it is so hard to get off.
Ukraine entered its market transition with the indicator of household final consumption equal to 57.1% of GDP (1990). As a result of a price shock that happened in the initial years of the transformation, this indicator declined in 1992 to 46.0%; however, this fall was compensated by 2005 when the country managed to attain the normal world's average in private consumption (57.9%). From here starts a period of really amazing growth in private consumption of Ukrainian households[11]: 63.0% in 2010, and 80.0% in 2012; only afterwards can we see a certain decline to 65.3% in 2016, which took place due to a collapse of the national currency, high inflation and an abrupt fall in real incomes.
The considerable overstatement of the share of household consumption distorts the entire macroeconomic structure and deprives economic development of the needed investment resources. The Ukrainian case has demonstrated this convincingly.
The shares of general government final consumption expenditure in the world on average had also been extremely stable over the entire 1990s and fluctuated within a narrow corridor slightly above the 16 percent point[12]. But in the 2000s, we can witness a certain growth of this indicator, most conspicuous in the aftermath of the 2008-09 global crisis when this indicator surged to 17.5% in 2010 and stayed at 17.1% in 2015–2016. The latter period reflected the enhanced state interference into economy in the context of the anticrisis measures taken. It is indicative that for advanced OECD countries the mentioned shares are generally higher than the world's average; they fluctuated in the 1990s in the range of 17–18%, reaching 17–19% in the 2000s, with the climax of 19 percent happening right in the period of the measures adopted to tackle the 2008–09 global crisis. The trend towards an increased share of government consumption expenditure is also characteristic to rapidly growing East Asia & Pacific countries, which, prior to the well-known 1997–98 Asian crisis, had the indicator of government consumption at the level (13–14%) well below the world's average. But lessons derived from the crisis translated into a much more pronounced economic role of their governments that pushed the indicator above the 15 percent point — up to 16.2% in 2016. On the other hand, the least developed and poor nations are characterized by generally low levels of government consumption, usually at 11–14%, with a persistent downward trend in the last decades among heavily indebted countries resulting from economic liberalization underway in this part of the world economy.
The changes in the share of government final consumption expenditure in Ukraine has had an explicitly wave-like character, with rises and falls happening within a rather wide range (17–21%). Overall, the Ukrainian government consumes much more in comparison to governments of developing nations. And despite the fact that Ukraine's respective indicators are lower than those of the countries with socially oriented development models (characterized by enhanced levels of government expenditure), we should understand that in the latter case they are largely targeted at the formation and development of human and intellectual capitals, while in Ukraine it is primarily a container for consumption, with best opportunities for those having access to the distribution of state budget resources and government procurement. Therefore, in many European countries, the existing structure of government expenditure supports economic development, while in Ukraine, conversely, it predominantly inhibits development by diverting public resources from development objectives to overconsumption of the richest segments of the population.
In this context, an important peculiarity must be emphasized here: the shares of final consumption expenditure with regard to households and government are usually inversely correlated (at least in economically successful countries).This means that, depending on the socio-economic model, a nation and its government may put more emphasis either on private consumption (combined with private responsibility for the outcomes of their economic activities) or on public forms of consumption performed via state budget and other financial resources at the government's disposal (which enables implementation of various social programs and supports inclusive development, but without any constriction of the area of private responsibility and competition). However, if here the conjunction "and" appears instead of "or", the entire structure of consumption undergoes substantial distortions, as such a combination exists exclusively at the expense of constricted spheres of savings and capital formation, unless the latter is supported by sizeable inflows of investments from abroad. Nonetheless, the latter appears rather problematic under conditions that hardly provide for the development of national capital.
The evolution of capital formation, which is manifested by means of shares of gross capital formation (and primarily with regard to gross fixed capital formation) as percent of GDP, exposes distinctly the degree of a country's willingness to develop and, more generally, the degree to which its government, business and society are inclined to rank objectives of the future higher than those of the present day.
The world's average shares of gross capital formation as percent of GDP changed in the 1990–2016 period within a narrow corridor of 24–25%, while the share of gross fixed capital formation fluctuated in 1990–2016 within 23-24% (World Bank's Databank). For the advanced (OECD) countries, gross fixed capital formation ratios are relatively lower than the world's averages and they had an explicit downward trend — from 24.4% to 20.9%, most visibly in the EU — a decrease from 23.8% to 19.7%. This phenomenon indicates a high productivity level (including capital productivity) in the developed world, which enables development at a relatively lesser capital intensity. This is largely supported by innovations in the area of logistics of production and sales as well as the availability of developed financial markets that allow uninhibited mobilization of required amounts of capital assets. Apart of this, we may assume that the overall evolution of capital formation is affected by uncertainties associated with the final stage of the fifth K-wave and the initial phase of adaptation of new technologies of the future, most of them still competing currently with traditional technological solutions.
In contrast with this, dynamically developing countries are characterized by extremely high levels of capital formation that are directly associated with very high rates of savings, with their aggregate value sometimes exceeding the total of household consumption expenditures. The most vivid example of this model is the economy of East Asia, where the share of gross fixed capital formation was maintained over 1990–2016 at 29–32% or even significantly higher in some cases (in China, the relevant 1990 indicator was equal to 24.6% but raised to 45.0% in 2010, and remained very high in 2016 — 42.9%).
On the other hand, the least developed and the poorest countries have a low potential for capital formation, although they are rather active in their endeavors to eliminate these deficiencies. Thus, in 1990 the indicator of gross fixed capital formation across the least developed countries was equal, on average, to 12.9% but in 2016 it soared to 22.8%. Heavily indebted poor countries succeeded in raising this indicator over 1990–2016 from 15.4% to 25.1%.
Against this background, the evolution of capital formation in Ukraine appears as absolutely abnormal and might be assumed as testifying about the domination of the life credo proclaiming "après nous le déluge" ("after us, the flood"). In the bacchanalia of wasteful consumption at the top of the society, which commenced after 2005, the country's gross fixed capital formation plummeted from the point of 27.1% in 1992 to 13.5% in 2015. And only 2016 brought about certain positive signs of recovery with its 15.1%. Ukraine actually lost the decade since 2005, having demonstrated massive eating away of the nation's available capital that might deserve presence in the Guinness World Records collection. This namely process underpins the decreasing potential for economic development and pushes the country's economy to the periphery of the world system.
Finally, we should note that, by the values of exports and imports related to GDP, Ukraine also appears as a problem country. In 2016, as compared to 2000, there happened a pronounced decrease of the export to GDP ratio — from 62.4% to 49.3%. However, the evolution of the import to GDP ratio did not make a similar trajectory: the 2016 indicator (55.5%) was only negligibly lower than the peak reached in 2000 (57.4%) and has been showing a distinct upward trend since 2005. As a result, Ukraine's patterns characterizing exports and imports to GDP ratios have been increasingly resembling those of the heavily indebted poor countries and the least developed nations, which have permanent and sizeable external trade deficits.
Conclusions
Ukraine enters the currently coming epoch of cardinal global transformations with a significantly distorted economic pattern that has undergone, over the period of state independence, obvious structural simplification and has approached structural characteristics of the less developed countries.
Ukraine has been included in international production and exchange on the basis of an asymmetric model that predetermines a peripheral status of the national economy. The essential deformation of the economic structure has been largely caused by the overstatement of private (mainly elite) consumption and critically low levels of investments to augment fixed capital. They have restricted considerably economic modernization and development, and preserve this country's economic backwardness and low international competitiveness.
References
- Schwab, Klaus (2016). The Forth Industrial Revolution. Geneva: World Economic Forum.
- IMF. Balance of Payments Statistics Yearbook and data files. Accessed through World Bank's Databank. World Development Indicators. Retrieved from http://databank.world-bank.org/data/reports.aspx?source=world-development-indicators
- UN Comtrade database through WITS platform. Accessed through World Bank's Databank. World Development Indicators. Retrieved from http://databank.worldbank.org/data/reports.aspx?source=world-development-indicators
- UNCTAD. UNCTADstat database. Retrieved from http://unctadstat.unctad.org/Report Folders/reportFolders.aspx
- World Bank's Databank. World Development Indicators. Retrieved from http://databank.worldbank.org/data/reports.aspx?source=world-development-indicators
- WTO. World Trade Statistical Review 2016. Retrieved from https://www.wto.org/english/res_e/statis_e/wts_e.htm
- WTO. World Trade Statistical Review 2017. Retrieved from https://www.wto.org/english/res_e/statis_e/wts2017_e/wts17_toc_e.htm
[1] This publication was prepared following the results obtained within the Razumkov Centre's research project "Structural Transformations in the World Economy: Challenges for Ukraine" performed in 2017 due to financial support of the Ukrainian regional office of the Friedrich Naumann Foundation for Freedom (Friedrich-Naumann-Stiftungfür die Freiheit).
[2] A rather popular but comprehensive description of the content of the mentioned process is provided in the well-known book of Klaus Schwab, WEF President (Schwab 2016). This book provoked the respective discussions at the WEF Forum in Davos in February 2016. Basic problems that arise in this context are also covered in regular OECD reports ("OECD Science, Technology and Innovation Outlook", "Digital Economy Outlook"). They were also in the focus of the latest summits of G20 in Shanghai, China (2016) and Hamburg, Germany (2017) as well as respective preparatory forums, i.e. Think 20 in Berlin (May 2017), where the author of this paper had the opportunity to participate.
[3] Here and later on, cited statistical indicators are based on the World Bank's World Development Indicators, unless otherwise noted in the text.
[4] It is significant that these indicators were higher in economically underdeveloped and poor countries with low productivity where they reached 35 percent and more, while, for instance, in the economically advanced region of the EC, they remained at 2.6–2.7% of GDP point, and even in the Latin America and the Caribbean region (where agriculture constitutes an important part of economic activities) they rested at the level of 8.1–8.8% of GDP.
[5] International statistics treats as high-tech products those made in aerospace, pharmaceutical, computer industries, electrical machinery, and scientific instruments.
Source: UN Comtrade database through WITS platform.
[7] 2014. ** 1996.
[8] In China, this indicator for 2005 reached 30.7%, though later decreased to 26.6% in 2015; for Malaysia these figures made 52.7% in 2000 and 30.0% in 2015, and for Singapore — 55.0% and 33.5%, respectively.
[9] Data for the structure of trade in services: International Monetary Fund, Balance of Payments Statistics Yearbook and data files.
[10] Sometimes, a similar term is used — "global chains of value added".
[11] However, the hypertrophied macro-indicator of consumption has been caused mainly by the excessive private consumption of the upper segment (high-income) of the population.
[12] It is worth noting that we can find significant differences over some countries with regard to the size and dynamics of the shares of general government final consumption expenditure. While the EU average indicator for 1990–2016 was changing in the range of 19–22%, the respective indicators for France (21–24%), Finland (20–24%) and Sweden (25–27%) were noticeably higher than those for Germany (18–20%) or, for instance, those of Spain (16–21%) and Poland (18–19%) witnessed in 1995–2016. And in regard to Switzerland we can see an entirely "minimalist approach": the range of 11–12%.